A. Goals
The purpose of the Cheat-Checker assignments (hw04 and hw05) are to gain practice with functions, arrays, and strings, and learn about applications of string matching. The specific goals of this assignment are:
- Practice using functions
- Learn how functions can build on each other
- Use two-dimensional arrays
- Implement insertion sort
- Use StdDraw to visualize data interactively
B. Mid-semester evaluation
You are invited to complete the mid-semester feedback form. Professor Eaton and the TAs would love to hear how we can improve your CIS 110 experience for the second half of the semester.
C. Background
In Cheat-Checker, Part I, you wrote a program, CompareStrings, that compares two strings for similarity by aligning them and finding the lowest cost. For extra credit, you may also have chosen to write a program, CompareDocuments, that compares two documents in a similar way.
Part II builds upon CompareDocuments to visualise the range of similarity in a given pool of documents to highlight the pairs that are most similar. This is an example of another common task when considering protein matching and cheat-checking.
We provide you with a reference implementation of CompareDocuments, so you do not need to rely on the code you wrote for your last homework.
Protein matching
Comparing a protein from two different species can give us some information about how closely related they are, but it is even more interesting to compare the protein among numerous species. That helps us answer questions like, "Which two species are most closely related?" or "Which two species are most distant?" We can also build a phylogenetic tree that hierarchically groups species based on how similar the protein is, and thereby gain insight into the entire evolutionary tree. Computational biologists build similar trees of different genes to help learn about their functions—very similar genes often control similar functions. (This type of tree is called a minimum spanning tree, and is at the heart of many compression formats including JPEG, as well as being an essential part of route planning and many other algorithms. You will learn all about minimum spanning trees in CIS 121.) Two examples of phylogenetic trees based on the cytochrome c protein are shown below.
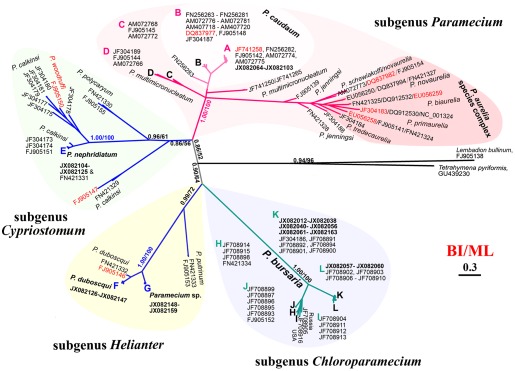
|
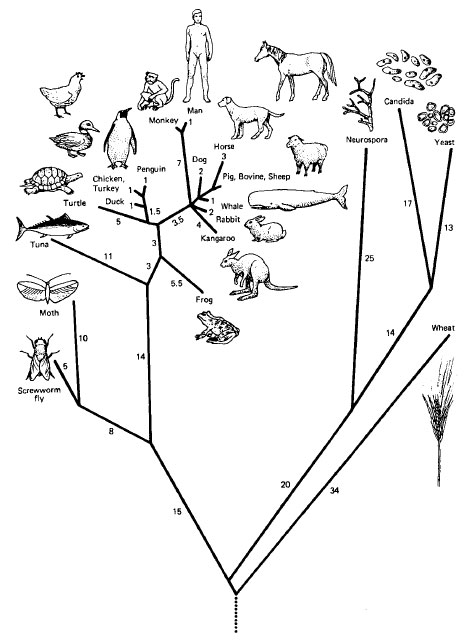
|
Cheat-checking
A typical cheat-checker compares all pairs of code submissions using techniques similar to those you implemented in CompareDocuments of the previous assignment, returning a sorted list of the top matches. But we're also interested in the distribution of top matches, i.e. the histogram of matching costs.
Any pair of independently written programs should have fairly similar matching costs (actually, you would expect the distribution of costs to form a bell curve); thus, assignment pairs with abnormally low matching costs relative to the cost distribution are likely to be copied.
The images below show the kind of histogram your program will generate, as well as a sample report generated by a cheat-checker.

|
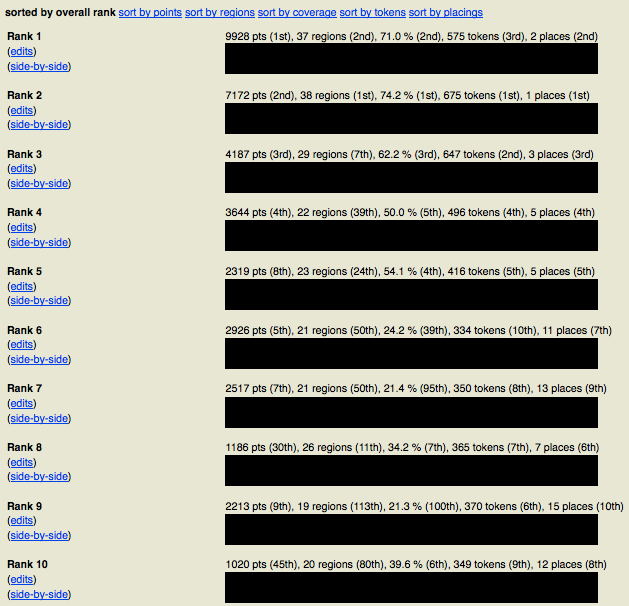
|
Your program in hw05 will have five main parts:
- computeCosts() will compute a list of the matching costs between each pair of documents, for all the pairs in the pool of documents.
- insertionSortCosts() will sort the list of matching costs in ascending order of cost.
- buildHistogram() will take a sorted list of matching costs and divides them into histogram bins.
- drawHistogram() will take a set of histogram bins and use StdDraw to create a static visualisation of these data.
- interactHistogram() will also take a set of histogram bins, and will use drawHistogram() and StdDraw to add interactive features to the histogram.
A. Histogram
A histogram is a representation of the distribution of numerical data. A histogram divides the range of data into bins and displays the frequencies of each bin in a tabular or graphical form.
Let's say we have the following data on the heights, in centimeters, of some of the CIS 110 TAs:
- 173
- 159
- 169
- 171
- 185
- 169
- 164
- 164
- 179
- 177
- 180
- 167
- 171
- 175
- 170
- 162
- 174
- 149
- 171
- 173
This list is not useful because it does not help us visualize the distribution or find any anomalies: we cannot see at a glance whether there are any TAs that are abnormally tall or short. However, we could group these data to see which heights are the most common. This is a tabular histogram:
| Height range / cm | Frequency |
| 145–150 | 1 |
| 150–155 | 0 |
| 155–160 | 1 |
| 160–165 | 3 |
| 165–170 | 3 |
| 170–175 | 8 |
| 175–180 | 2 |
| 180–185 | 2 |
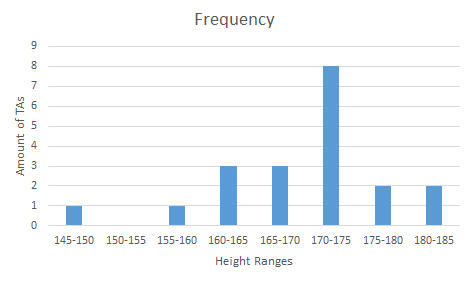
We now can easily see that most TAs have heights between 170 and 175 cm, and that there is a clear outlier who has a height between 145 and 150 cm.
We could further improve the presentation of these data by drawing a visual histogram:
We could also have used this histogram, with four bins instead of eight, if we had needed less detail:
| Height range / cm | Frequency |
| 145–155 | 1 |
| 155–165 | 4 |
| 165–175 | 11 |
| 175–184 | 4 |
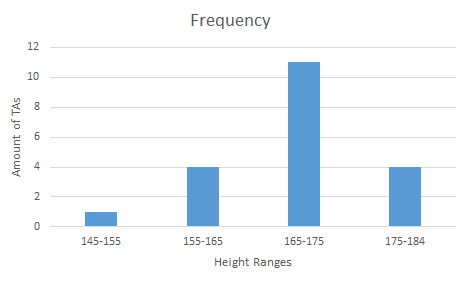
B. Reference implementation
We provide you with a compiled reference implementation of the program that you will write. You can run this reference implementation to explore how your program is supposed to work. You can also use the functions it provides as drop-in replacements for many of the parts that you will write so that you end each of the subsequent assignment parts with a complete, working program. This makes your program much easier to test.
Download the RankSimilarityReference.class reference implementation. In addition, download the data files cytochrome_c.txt (a data set of cytochrome c proteins for many different species) and costs-cheatchecker.txt (an anonymized data set containing cheat-checking data).
Run java RankSimilarityReference costs-cheatchecker.txt and java RankSimilarityReference cytochrome_c.txt. A histogram should appear visualising the cost data. Press 'p' to print the matches up to your mouse position, 'i' to invert the bar heights to highlight the shortest bars, and 'r' to recompute the histogram with a number of bins determined by your mouse position. Play around with the program to understand how it works.
C. 2D arrays
In this assignment, we will be using 2D arrays.
We strongly recommend that you read Section 1.4 of the textbook on this topic. A summary of 2D arrays is also provided on the booksite: http://introcs.cs.princeton.edu/java/14array/.
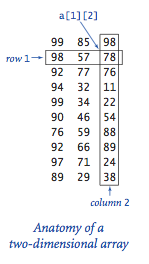
A 2D array is an array of arrays. You can visualize a 2D array by thinking of a table (i.e. a grid).
The type of a 2D array of ints is int[][]. Thus, this declares a 2D array of ints:
int[][] a;
To instantiate our int[][], we need to specify the number of rows in the 2D array. Let's say a has 10 rows:
a = new int[10][];
If we also know that each of the row in a has the same number of columns (say, 3), then we have a rectangular array, and we can write:
a = new int[10][3];
Thus, we can refer to the item in row 1 and column 2 as a[1][2]. For instance, we can write the following:
a[1][2] = 78;
System.out.println(a[1][2]); // prints 78
Conventionally, the first index refers to the number of rows and the second index to the number of columns.
Because a 2D array is an array of 1D arrays, each row in the 2D array is a 1D array. Thus, we can get the second row of a as a 1D array:
int[] x = a[1]; // x is the 1D array {0, 0, 78}
System.out.println(x.length); // prints 3
As with 1D arrays, Java initializes all entries in 2D arrays of ints to 0, doubles to 0.0, and booleans to false.
To access each of the elements in a 2D array, we need nested loops:
double[][] b = new double[M][N];
for (int i = 0; i < M; i++)
   for (int j = 0; j < N; j++)
      b[i][j] = 0;
Setting values at compile-time You can set the values in a 2D array at compile-time. This only works when declaring and instantiating arrays at the same time.
int[][] a = {
   { 99, 85, 98 },
   { 98, 57, 78 },
   { 92, 77, 76 },
   { 94, 32, 11 },
   { 99, 34, 22 },
   { 90, 46, 54 },
   { 76, 59, 88 },
   { 92, 66, 89 },
   { 97, 71, 24 },
   { 89, 29, 38 }
};
Ragged arrays Not all of the rows in a 2D array need to have the same length—an array with rows of non-uniform length is known as a ragged array. We can instantiate a ragged array without specifying the number of columns:
int[][] c = new int[3][];
which then requires us to instantiate each row individually as an int[]:
c[0] = new int[5];
c[1] = new int[3];
c[2] = new int[7];
before we are able to assign values to the entries of the 2D array:
c[1][2] = 4;
This code prints the contents of c:
for (int i = 0; i < c.length; i++) {
   for (int j = 0; j < c[i].length; j++) { // notice the use of c[i].length to get the length of the ith array
       System.out.println(c[i][j] + " ");
   }
}
A. The API
You will write a program RankSimilarity.java with functions to match all pairs of documents, sort the matches by cost, compute a histogram of the sorted matches, and plot the match costs in an interactive histogram. It must conform to the following API:
public class RankSimilarity
--------------------------------------------------------------------------------------------------------
/* Computes the cost values for all pairs of documents
* Returns a 2D array with one row for each document pair
* docs is an array of documents; each document is a String[] in docs
*/
public static int[][] computeCosts(String[][] docs)

/* Sorts costs in increasing order of cost value using insertion sort */
public static void insertionSortCosts(int[][] costs)

/* Computes the histogram array of the cost values in costs
* Returns an array giving the number of matches in each histogram bin
* numBins is the number of bins for the histogram (will be at least 1)
* Computes modified inverse of bin values if inverse is true
*/
static int[] buildHistogram(int[][] costs, int numBins, boolean inverse)

/* Display a static visualization of histogram */
public void drawHistogram(double[] histogram)

/* Computes the histogram from costs and displays an interactive visualization */
public void interactHistogram(int[][] costs)

/* Read in the protein file, cost matrix, or list of documents,
* compute all match costs, sort them, and create a histogram
*/
public static void main(String[] args)
B. Getting Started
- If you have not yet done so, download the RankSimilarityReference.class reference implementation and save it to your folder for this homework assignment. You may need to right-click the link to save the file rather than running it. This is a compiled Java program, not source code that you can examine. However, you will be able to run it and compare your output to its output for testing purposes. You can also call its functions directly for more fine-grained testing. Later steps of the assignment include suggestions for how to do this.
- Download the skeleton RankSimilarity.java file, and save it in your folder for this homework assignment.
- Download RankHelpers.java, and save it in your folder for this homework assignment. This file includes a function to read in data, and is used by RankSimilarity.main().
- Download CompareDocumentsReference.class, and save it in your folder for this homework assignment. You will need to call CompareDocumentsReference.compareDocuments() when writing RankSimilarity.computeCosts().
- Download CompareStringsReference.class and save it in your folder for this assignment. This is used by CompareDocumentsReference.
- Download cytochrome_c.txt and save it in your folder for this assignment. This file contains a data set of cytochrome c proteins for many different species. You will use this for testing.
- Download costs-cheatchecker.txt and save it to your folder for this assignment. This is an anonymized data set containing cheat checking data. You will use this for testing.
- Make sure the program compiles. Each of the skeleton functions includes a return statement so that it will compile. You will need to replace these with your own code eventually.
- Add an appropriate file header.
Write and test computeCosts() first, before starting to work on the other functions. computeCosts() takes a set of documents as a 2D array. It returns a list of the costs associated with each possible pair of documents as a 2D array. More details are explained below.
A. main() method
We have given you a main() method in the skeleton RankSimilarity.java that you will use for testing. Please read all of main(). Make certain that you understand every step of what happens in main(). If you need help understanding main(), feel free to ask.
Make sure that you make a genuine attempt to understand main(). If you have questions in office hours that suggest you haven't made an effort to understand main() on your own, CIS110 Staff will likely ask you to re-read main().
Below is the API for the RankHelpers class that is called by the provided main().
public class RankHelpers
--------------------------------------------------------------------------------------------------------
/* Read in an array of precomputed cost values from the file at filename
* Assumes that the file at filename is in the same format as costs-cheatchecker.txt
* Returns the 2D costs array
* (This skips the cost value computation, which is useful when there is a large amount of data to process,
* or when the data are confidential)
*/
public static int[][] readCosts(String filename)

/* Read in a list of proteins from the file at filename
* Assumes that the file at filename is in the format of cytochrome_c.txt
* Returns an array of documents, comprising the lines of filename
* (This treats each line in filename as an individual single-line document)
*/
public static String[][] readProteinData(String filename)

/* Read in the documents at the locations in the list filenames
* Returns an array of these documents
* (This requires a large number of documents, at least 30, to give meaningful results)
*/
public static String[][] readDocumentArray(String[] filenames)
B. Input
computeCosts() takes a parameter, docs, a 2D array of Strings. docs contains the contents of the set of documents for which the costs need to be computed. The number of documents in the set is n.
As in hw04, each document is represented as a 1D array of Strings, where each String is a line in the document. Naturally, an array of multiple documents would be a 2D array of Strings. Thus, docs[i] is a 1D array of Strings representing document i, and docs[i][j] is a String representing the jth line of document i.
This is a possible visual representation of docs. You can view the input, docs, as a table, where the lines of each document are represented in the columns, and the documents in rows.
(The computer does not store a 2D array in this tabular format, so this is not what docs looks like in the computer's memory. Below, we arbitrarily chose to display documents as rows and lines as columns, since it is conventional to display the first index in rows and the second as columns. We could have chosen to transpose rows and columns in the below table.)
docs[0]: String[]: document 0
|
|||||
docs[1]: String[]: document 1
|
|||||
docs[2]: String[]: document 2
|
|||||
| ... | |||||
docs[docs.length - 1]: String[]: last document
|
C. Output
(This section may seem like explicit instructions, but there are more clarifications about the instructions in the below sections as well.)
computeCosts() returns a 2D array of ints that contains n(n-1)/2 rows, each with 3 columns. Below, we will refer to this output array as costs. Each row represents the result of matching a pair of documents in docs. For a given row in costs, the first column is the index in docs of the first document in the pair; the second column is the index in docs of the second document in the pair. The third column is the cost value from comparing these two documents.
Be sure not to have duplicate entries: if the first document in the pair is at index f in docs, and the second document is at index s, your resulting costs array should include only the pair where f < s, excluding the pair where s < f.
Also, be sure not to compare a document against itself.
For now, the order of the rows in your output can be arbitrary.
This is a possible visual representation of costs. You can view your output, costs as a table, where each row represents a match between each pair of documents. Because the document pairs do not need to be in any particular order in the costs array, we represent the first index of the 2D array as the indices a, b, c, d, e, and z. The following is simply a representation to give you an idea of what costs would look like.
| ... | |||
costs[a]: int[]: docs[0] and docs[1]
|
|||
| ... | |||
costs[b]: int[]: docs[0] and docs[2]
|
|||
| ... | |||
costs[c]: int[]: docs[0] and docs[3]
|
|||
| ... | |||
costs[d]: int[]: docs[1] and docs[2]
|
|||
| ... | |||
costs[e]: int[]: docs[1] and docs[3]
|
|||
| ... | |||
costs[z]: int[]: docs[n-1] and docs[n]
|
|||
| ... |
You will need to use CompareDocumentsReference.compareDocuments() to compute the cost of comparing two documents. The API for CompareDocumentsReference.compareDocuments() is as follows:
public class CompareDocumentsReference
--------------------------------------------------------------------------------------------------------
/* Return the cost of the best alignment of two documents by aligning all pairs
 * of lines.  Lines in one document that match a "gap" at the
 * beginning or end of the other document, should be treated as
 * matching an emtpy line ("").
 */
public static int compareDocuments(String[] firstDocument, String[] secondDocument, boolean printBestAlignment)
You should call CompareDocumentsReference.compareDocuments() with printBestAlignment set to false.
D. Loop
Write a loop to iterate through each pair of documents (docs[f], docs[s]) in docs.
- This loop will be a nested for-loop.
- Carefully think about the necessary continuation conditions for both for loops so that you include only the pairs (docs[f], docs[s]) where f < s.
E. costs array
Instantiate and populate the costs array.
- Outside the loop, declare the costs array and instantiate it with the correct dimensions.
- For each iteration of the loop, fill in the next blank row of costs using the above specification.
- You should ensure that you only fill in blank rows. It is easiest to do this by keeping track of the index of the next blank row in costs.
F. Checkpoint
To test your computeCosts() function, run your file with cytochrome_c.txt as the only command-line argument. As you can see in your computeCosts() function, the skeleton file returned the reference's costs.
Make sure that the graph generated by your costs array and the reference's costs array are the same graph.
Allow a little bit of time for the run command to execute. It shouldn't take longer than a minute.
insertionSortCosts() takes a 2D int array, costs, that has the same format as the output of computeCosts(), described in Section 4C, and uses insertion sort to sort the rows of the 2D array in increasing order of cost value (i.e. sort by the third column). More details are explained below.
A. Understanding insertion sort
Review the lecture slides and Chapter 4.2 of the textbook, Sedgewick and Wayne. Carefully read the insertion sort algorithm.
B. Implementation
Implement the insertion sort algorithm to sort costs by the cost value column.
You will need to swap entire rows of costs. Recall that each row is of type int[] and the third column refers to costs. You should not write a new function to swap rows.
C. Checkpoint
If you run your code with cytochrome_c.txt, you should get a histogram that looks very similar to the following. Of course, you can use any colors that you want.
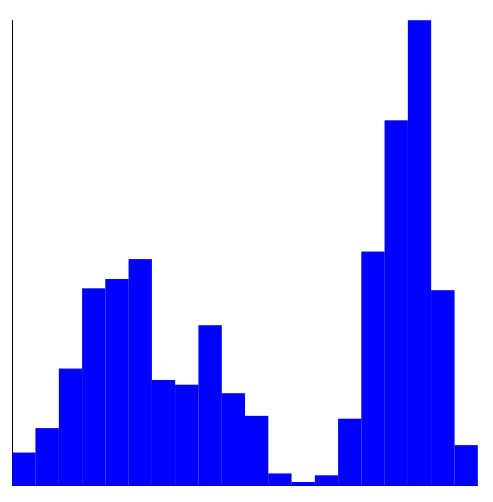
buildHistogram() takes a sorted array of costs, an integer numBins, and a boolean inverse as its parameters, and returns an array of doubles, which we will refer to as histogram, where this histogram array has length numBins. Each value in histogram represents a count of the number of rows in costs falling into each bin where a bin is represented by each index of histogram. If the parameter inverse is true, buildHistogram() takes the reciprocal of each nonzero value in histogram. More details are explained below.
A. Loop
Declare the array that you will return, histogram, and write a loop that iterates through each row in costs and partitions the cost values into the bins in histogram.
- The bins in histogram each cover a range of cost values, where the size of the range is the highest cost value in costs divided by numBins. Recall what happens when you divide numbers of respective types. Since costs is sorted increasingly, the highest cost value is in the last row of costs.
- To compute the bin into which a given row's cost value should fall, divide the cost value by the range size, rounded down to the next integer.
- histogram[i] keeps track of the number of cost values falling into bin i.
- You will need to handle the largest cost value separately by putting it into the bin histogram[numBins-1] (rather than the non-existent, out-of-bounds bin histogram[numBins]).
B. Modified inverse
To highlight pairs of documents with abnormally low costs, if the boolean parameter inverse is true, we take a modified inverse of each value in histogram after computing the histogram values:
- If inverse is true, replace each nonzero value n in histogram with its reciprocal 1/n.
- Do not change any values of n where n is zero.
The effect of inverting the histogram is that very tall bars in the histogram disappear (1 / very large number is close to 0), while very short bars suddenly get tall (the lowest non-zero count a bin could have is 1, and 1 / 1 = 1). For cheat-checking, we aren't interested in the masses of assignment pairs that are equally similar—the ones that correspond to tall histogram bars. Instead, we want to see the very few assignment pairs that are much more similar than all other pairs. In terms of the histogram, we expect most bins corresponding to low cost/high similarity to have a zero count, but a few may have a nonzero (but small) count corresponding to plagiarized assignments. On the standard histogram, the counts in those bins are still so low that we can't see the bars, but inverting them makes the bars large. So the plagiarized assignments tend to pop out, and the non-plagiarized ones tend to disappear.
C. Checkpoint
If you run your code with cytochrome_c.txt, you should get a histogram that looks very similar to the following.

Now that you have a histogram of costs, you can write a function to visualize it: drawHistogram(). More details are explained below.
A. Draw histogram
- Draw the x- and y-axes of your graph. They intersect at the point (0, 0), which should be located near the bottom left of the window (StdDraw might add a 10% margin to the dimensions of the window depending on your software). You do not need to label your axes or indicate any kind of scale.
- The width of each rectangle should be such that all the bins fit on the x-axis. Use the number of bins and the fact that the x-axis scales from 0 to 1 to determine the width of each bin.
- The height of the tallest bin should be 1. The height of each bin is equal to the ratio of the bin value to the maximum bin value. (You will need to determine the maximum bin value before you are able to find the heights of the other bins.)
- Use the bin index and the bin width to determine the x-coordinate of the lower-left corner of the rectangle. Using the lower-left corner, the bin width, and the bin height, you can calculate the other x- and y-coordinates.
- Plot each histogram bin as a rectangle using StdDraw.filledRectangle() or StdDraw.filledPolygon().
- Pick any color you like for the rectangles.
B. Checkpoint
If you run your code with cytochrome_c.txt, you should get a histogram that looks very similar to the following. Of course, you can use any colors that you want.

You will now add a few interactive features to the histogram you drew in the previous section. interactHistogram() takes an array of costs as an argument, and calls buildHistogram() and drawHistogram() in response to interaction events (key presses and mouse moves). More details are explained below.
A. Event loop
- So that your user is able to initiate interaction events at any time, you will need a loop that runs forever. The easiest way to do this is to use while(true).
- Within this loop, call buildHistogram() with 20 bins and with inverse set to false.
- Call drawHistogram() with the result of buildHistogram().
B. Mouse line
Draw a vertical line at the mouse's x-coordinate from the top to the bottom of the plot (within the bounds of the histogram y-axis).
- Use StdDraw.mouseX(), which returns the x-coordinate of the mouse as a number between 0 and 1. (The returned value may be outside this range if the mouse is outside the histogram axes; do not draw the mouse line in this case.)
- The line should be drawn behind the bars of the histogram.
- You can use any color or line style for the mouse line.
C. Key events
Certain behaviors will be triggered in your program when the user presses certain keys. StdDraw has a facility to detect key presses.
- Use the StdDraw.hasNextKeyTyped() function to see whether the user has typed a key, and use StdDraw.nextKeyTyped() to obtain this key as a char. StdDraw.nextKeyTyped() will throw an exception if StdDraw.hasNextKeyTyped() is not true.
- StdDraw.nextKeyTyped() can only be called once each time StdDraw.hasNextKeyTyped() is true. Therefore, you will need to store the return value of StdDraw.nextKeyTyped() as a variable.
- If the 'p' key is pressed, find the mouse's x-coordinate and multiply by 100, and cast to an integer. If the mouse location is a value between 0 and 1, print out this many best document pairs in descending order of cost value. For instance, if the x-location is 0.1, you should print the 10 document pairs that are the most similar, starting with the 10th most similar and ending with the most similar. For each pair, you must print all the data about the pair (index of the first document, index of the second document, and cost value), but the format does not need to be identical to the reference output.
D. Modifying the histogram
Your program will start by drawing a histogram with 20 bins and with inverse set to false. The user can change this by pressing the following keys.
- Outside your event loop, declare variables for numBins and inverse, setting them to the above values for the start of your program.
- If the 'r' key is pressed, recompute the number of bins using the following formula.
# of bins = 100 * mouse's x location / 5
- If the 'i' key is pressed, toggle inverse.
- Modify your call to buildHistogram() to rebuild the histogram using the new values of these variables.
E. Checkpoint
- Uncomment the call to interactHistogram() in main() to test your function.
- To see if your interactHistogram() matches the reference implementation, replace your call to interactHistogram() with one to RankSimilarityReference.interactHistogram(). They should behave exactly the same (barring differences in the colour of the bars).
Extra credit on this assignment is open-ended. We provide many ideas here, although you will be able to earn at most 3 extra credit points (and remember that the impact of extra credit on your grade is limited). Some of these ideas are relatively easy, and others are harder. Finish the assignment first, submit it, then work on these ideas as they interest you.
You should implement your extra credit in a program RankSimilarityEC.java that you submit as a separate file from your main submission. This simplifies grading and gives you more latitude to change any part of the program you want. You can also submit a zip file, extra.zip, containing any additional java files, data, images, etc. that are needed to run you extra credit.
- Display some status information in the application window such as the number of matches that will be printed if you press 'p' and the number of bins that will be used for a new histogram if you press 'r'.
- Improve the appearance of the axes, e.g. by adding arrows at the ends, tic marks, a scale, and names.
- Make the bars of the histogram more attractive. This could include highlighting the bar under the mouse (and possibly displaying information about it), a more elaborate color scheme, more interesting shapes than rectangles (provided they don't make the data harder to visualize), incorporating images, animating their appearance, or anything else you think improves the data visualization or is cool.
- Fit a Gaussian (bell curve) or other model to the histogram data, and superimpose it on the histogram. There are a few possible ways to draw a curve, including drawing line segments, drawing points and drawing a polygon. Any of these are fine. For the most accurate curve, you'll need one vertex for every pixel in the x-direction, but you could specify fewer vertices if that takes too long to draw.
- Experiment with better ways to highlight suspicious pairs of assignments than just inverting the histogram values. For instance, if you implement the previous idea, you could also mark any histogram bin that is much larger than a Gaussian model would predict. (We have not tested this, so we can't say how well they will work; you might well come up with an idea that works better!)
Submit RankSimilarity.java and your completed readme_rank.txt.
Make sure that in the file you submit, each function runs the code that you wrote and does not run the reference implementation (which is the default implementation of the skeleton file).
You may also submit RankSimilarityEC.java for extra credit, along with any additional material needed for your extra credit implementation in extra.zip, but these are not required.
If you have not already done so, please fill out the anonymous Mid-Semester Feedback Form to help us improve the second half of the course.